
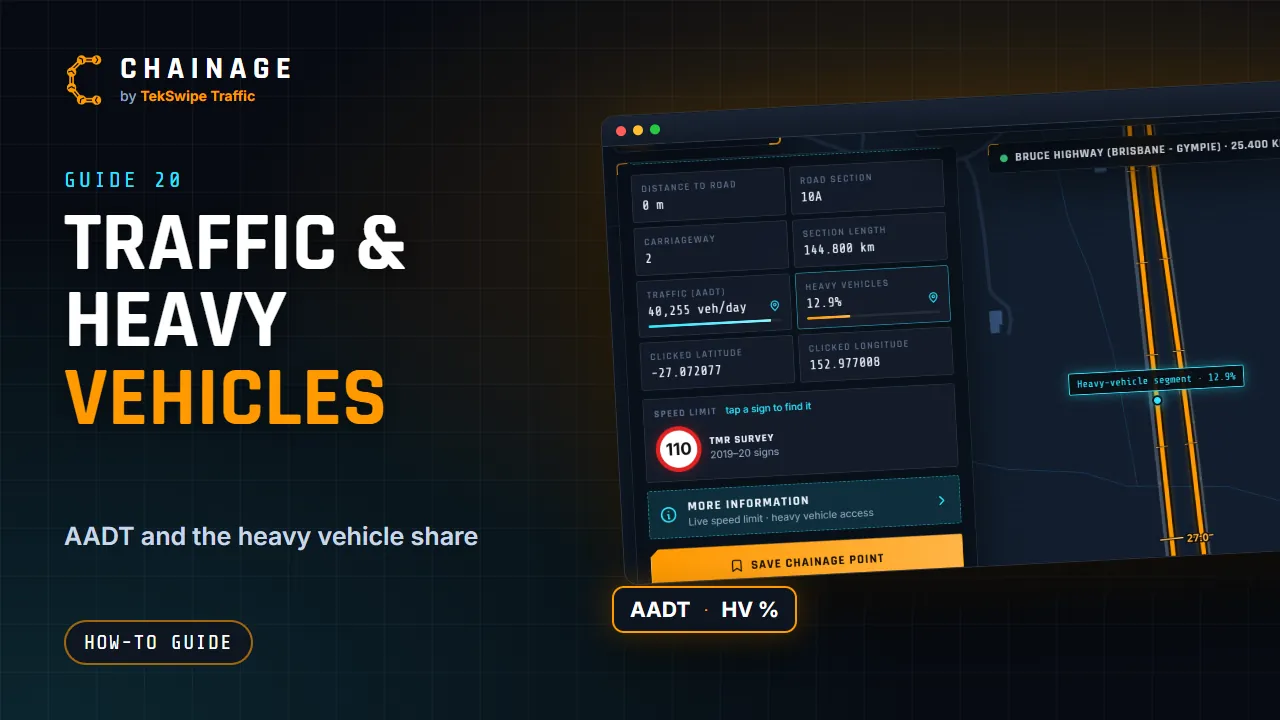
For state-controlled roads, the chainage card shows how busy the road is and how much of that traffic is heavy vehicles.
Traffic (AADT)
AADT is annual average daily traffic: the average number of vehicles a day over a year. The card shows it as vehicles per day, for example 15,674 veh/day.
The bar under it uses a log scale, so it's easy to compare quiet and busy roads. A full bar is about 100,000 vehicles a day.
Under the figure is where it was counted, for example Permanent counter · 43 km away or Counted 2019 · here. On a divided road, each carriageway shows its own direction's traffic.
Heavy vehicles
Heavy vehicles is the share of that traffic made up of heavy vehicles, for example 12.4%. The bar is full at 40%.
When it says Unknown
Unknown means TMR's data has no figure for that stretch of road. Council roads don't show traffic figures at all, because this is TMR data for state-controlled roads only.
A few roads, mostly motorway ramps and links, have no traffic count site of their own. Their tiles have no pin icon, because there's no count to show.
See the count site
Every figure comes from one of TMR's traffic count sites, and one site's count stands for a whole stretch of road, sometimes 100 km or more. Tap Traffic (AADT) or Heavy vehicles (the tiles with a small pin icon). The map shows the count site with a purple counter marker, and the stretch of road its count stands for as a dashed purple line.
Tap the counter marker to open the site's panel:
- The latest figure and the year it was counted. A permanent counter counts all year. Other sites are counted for about a week every few years, and TMR estimates the years in between. The panel says when a figure is an estimate.
- Each way: the traffic in each direction, named by the road's ends, for example Towards Lakeland.
- Vehicles by type: light vehicles, rigid trucks, articulated trucks, and B-doubles and road trains, with all 12 vehicle classes underneath.
- Counts by year: a bar for each year back to 2004. Solid bars were counted that year; outlined bars are TMR's estimates. Hover or tap a bar for its figure, or open the table.
- Traffic by hour: average vehicles an hour for weekdays, weekends or one day of the week, both ways or one way, with the busiest hour.
Queue length calculator
For a stop/slow or portable traffic signal site, the count site's panel works out how far traffic will queue on each approach, and where the advance warning signs go. It follows the Queensland Guide to Temporary Traffic Management (QGTTM) Part 3, Section 4.8.
Enter the max stopping time in minutes: the time from when the traffic controller stops traffic until they release it again. That includes both queues travelling the closure, any hold time, and a margin for slow vehicles. The 2, 5, 10 and 15 buttons fill it in.
Everything else comes from the data. The speed limit is the one where you looked up the chainage, and the works hours are the whole day; change either if you need to. For each approach, the calculator shows:
- The queue, from the busiest hour on that approach (from the site's hourly counts, scaled up if traffic has grown since) ÷ 12 for a five-minute count, split by its heavy vehicles. Average vehicles count 1.2 m and heavy vehicles 4 m for each minute of stopping time (QGTTM Table 4.3), part vehicles are rounded up, and the queue is at least 26 m.
- Where the signs go, measured from the traffic controller: the end of queue (6 m to the stop line plus the queue), the primary PREPARE TO STOP (the AGTTM Part 7 Table 2.3 distance before the end of queue), an additional PREPARE TO STOP 120 m from the controller when the primary is over 240 m away, repeaters when it's over 300 m (Table 4.4(a)), the 60 km/h zone on faster roads, and ROADWORK AHEAD or a VMS (Table 4.4(b)).
- A chart of the queue for each hour, so you can see when the quieter times to work are.
These are estimates from TMR's counts. Where you can, check them with a real five-minute count at the busiest time the site will be occupied, and watch the queue on site against the end-of-queue marker. The traffic guidance scheme is still the traffic management designer's to check, including sight distance and intersections in the advance warning area.
Placing the signs on the map
Once the stopping time is in, Place the signs on the map sets out the signs for a portable traffic signal site from these distances. Enter the chainages where the work area starts and ends: a signal stands at each end, and each approach's signs are shown in a list and as dots on the map before anything is added.
- For each approach, in the order drivers meet them: ROAD WORK AHEAD / 80 / REDUCE SPEED, WORKER / 60 / REDUCE SPEED, QUEUED TRAFFIC AHEAD / PREPARE TO STOP (the primary), TRAFFIC SIGNALS / PREPARE TO STOP, STOP HERE ON RED SIGNAL and the portable traffic signal.
- On an undivided road the speed signs are back-to-back, bringing the speed up again for traffic leaving: END ROAD WORK and the road's speed on the back of WORKER / 60 (or of ROAD WORK AHEAD when there's no WORKER sign).
- Speed at the signals: 60 on roads over 60, or 40, which adds blank / 40 / REDUCE SPEED one sign spacing before the stop line, with blank / 60 / ROAD WORK on its back. On a road over 80 km/h the first sign steps the speed down (110 or 100 → 80 → 60).
- Speed signs on both sides (over 500 vehicles a day) and All signs on both sides (7,500 or more) add copies on the right; any sign where two lanes go one way gets one too (lanes from OpenStreetMap). See Signs on both sides.
Open the project you want them in first: they go into the layer you're adding to, labelled by approach (W1, W2… and A1, A2…), each facing its traffic on the left of the road, with a note saying why it's there. They're picked once placed, so you can drag them all or move single signs into place, and one Undo (Ctrl+Z) takes them all out again. Check every spot on site for sight distance, driveways and intersections.
TMR publishes the year of each count, not the exact dates. The figures are averages, so traffic on a particular day can be quite different. They come from TMR's traffic census, published as open data (CC BY 4.0). See Where the data comes from, and Read the chainage card for the rest of the card. Terms are explained in the Glossary.